Getting Started
Understanding Your Dashboard
A walkthrough of your home screen - what each section shows, what the numbers mean, and where to click next.
Last updated
Welcome to your dashboard
Your dashboard is the home base for everything happening across your wealth - bank and brokerage accounts, real estate, private equity stakes, crypto, and more. It pulls live data from your connected accounts and rolls everything up into a single view so you always know where you stand.
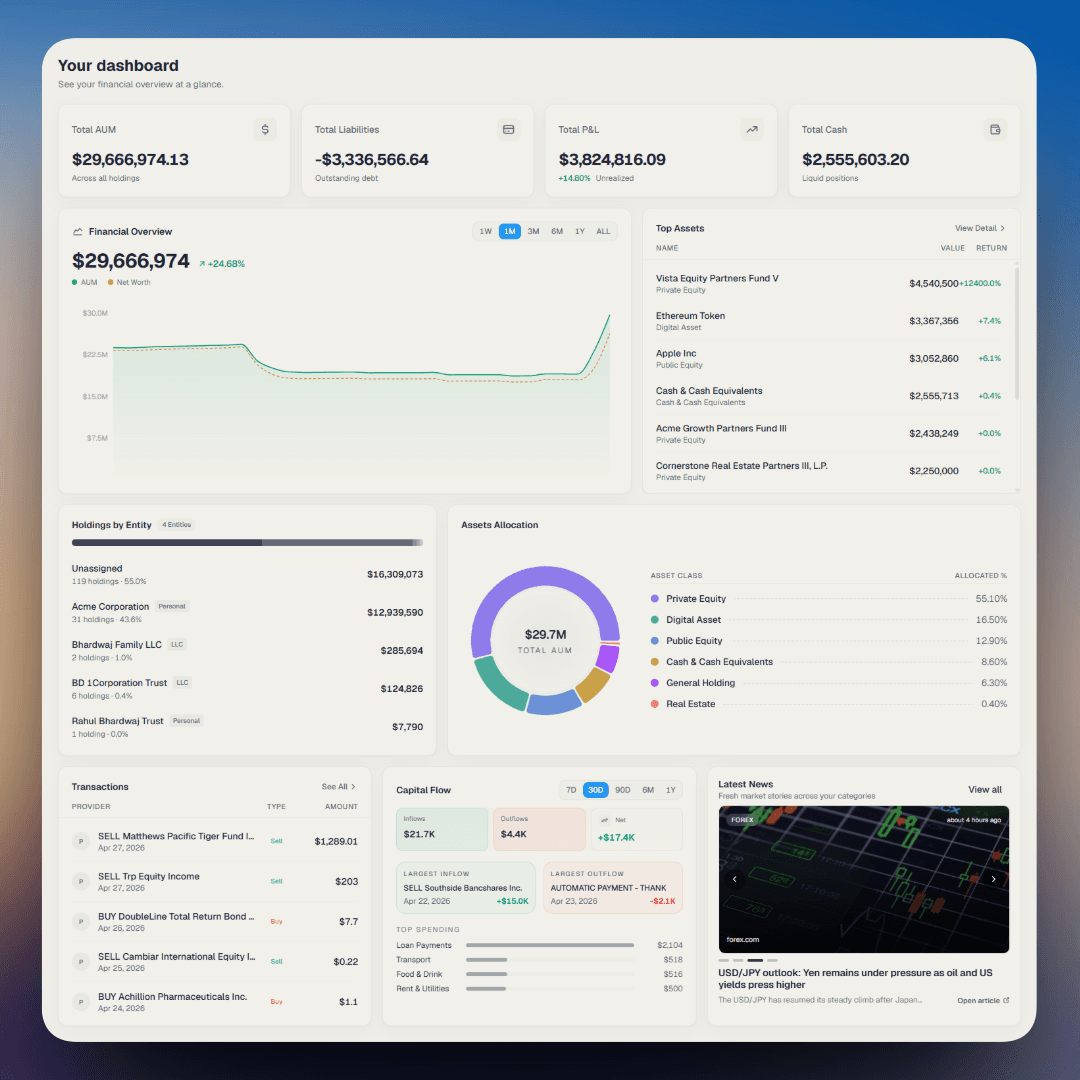
This guide walks through each section of the screen, top to bottom, left to right. Read it once and you'll know exactly what every number means and where to click for more detail.
The top row - your four headline numbers
Across the top of the dashboard you'll see four large cards. These are the highest-level summary numbers for your entire portfolio. They update automatically as your connected accounts sync.
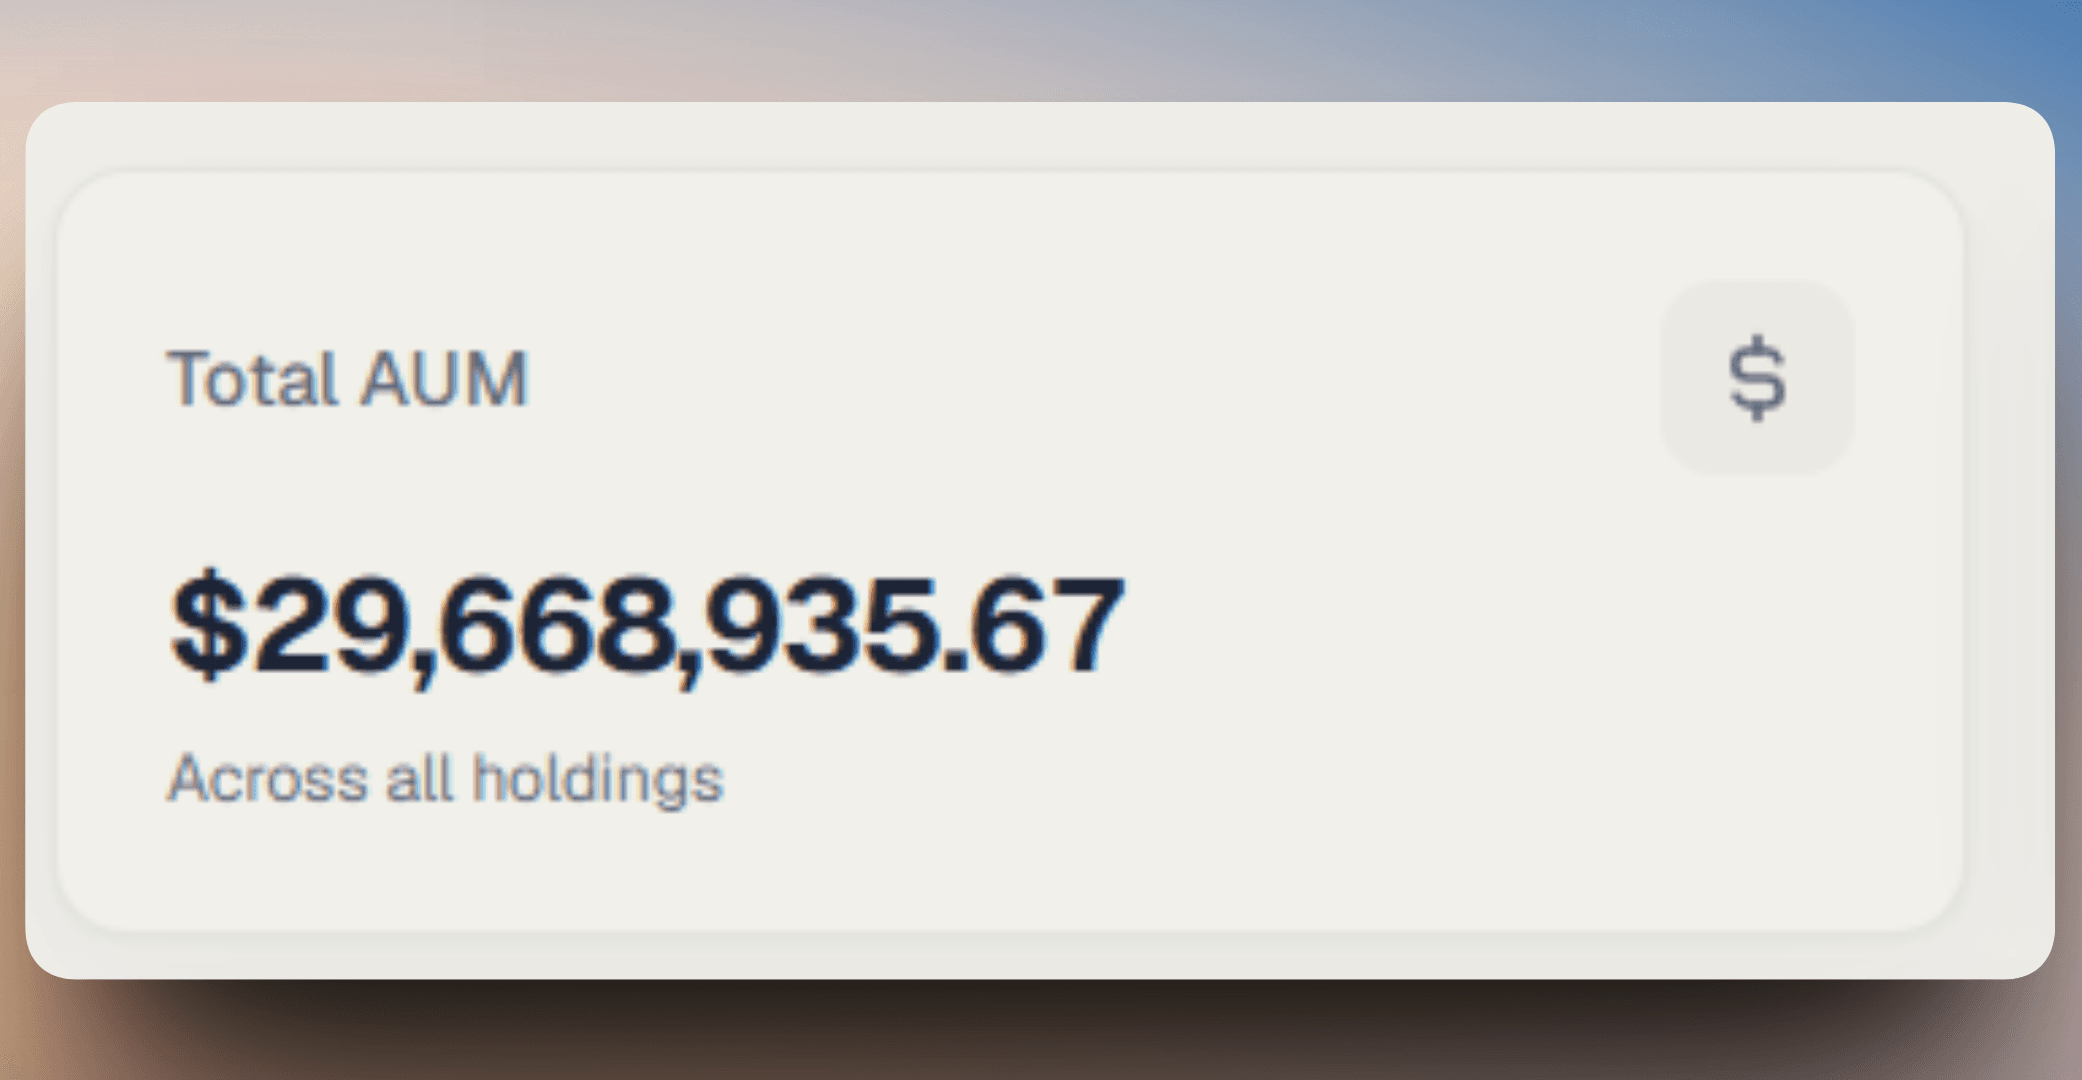
Total AUM - Assets Under Management. The combined market value of everything you own across all connected and manually-tracked holdings - cash, stocks, real estate, private equity, crypto, and more.
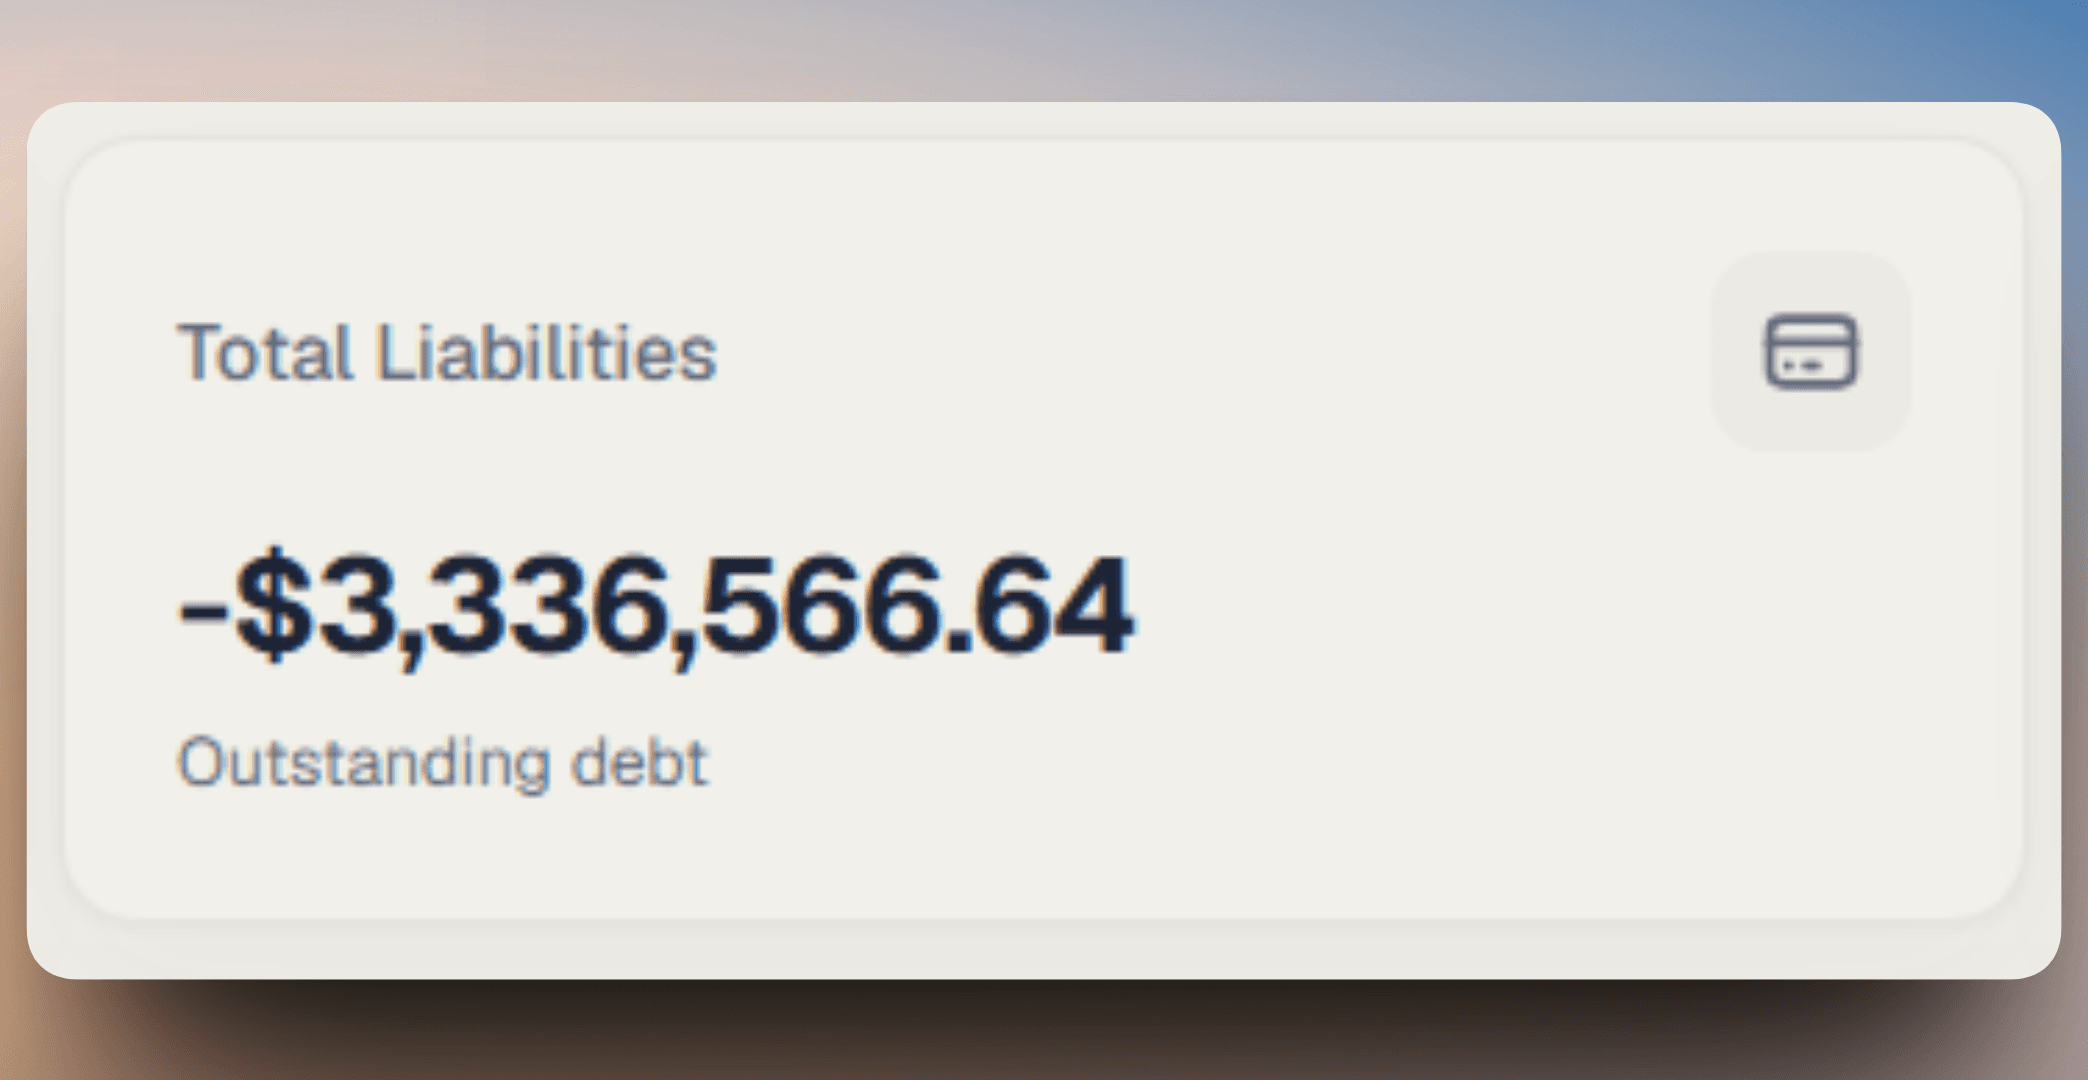
Total Liabilities - All outstanding debt: mortgages, loans, credit balances, and lines of credit. Shown as a negative number because it reduces your net worth.
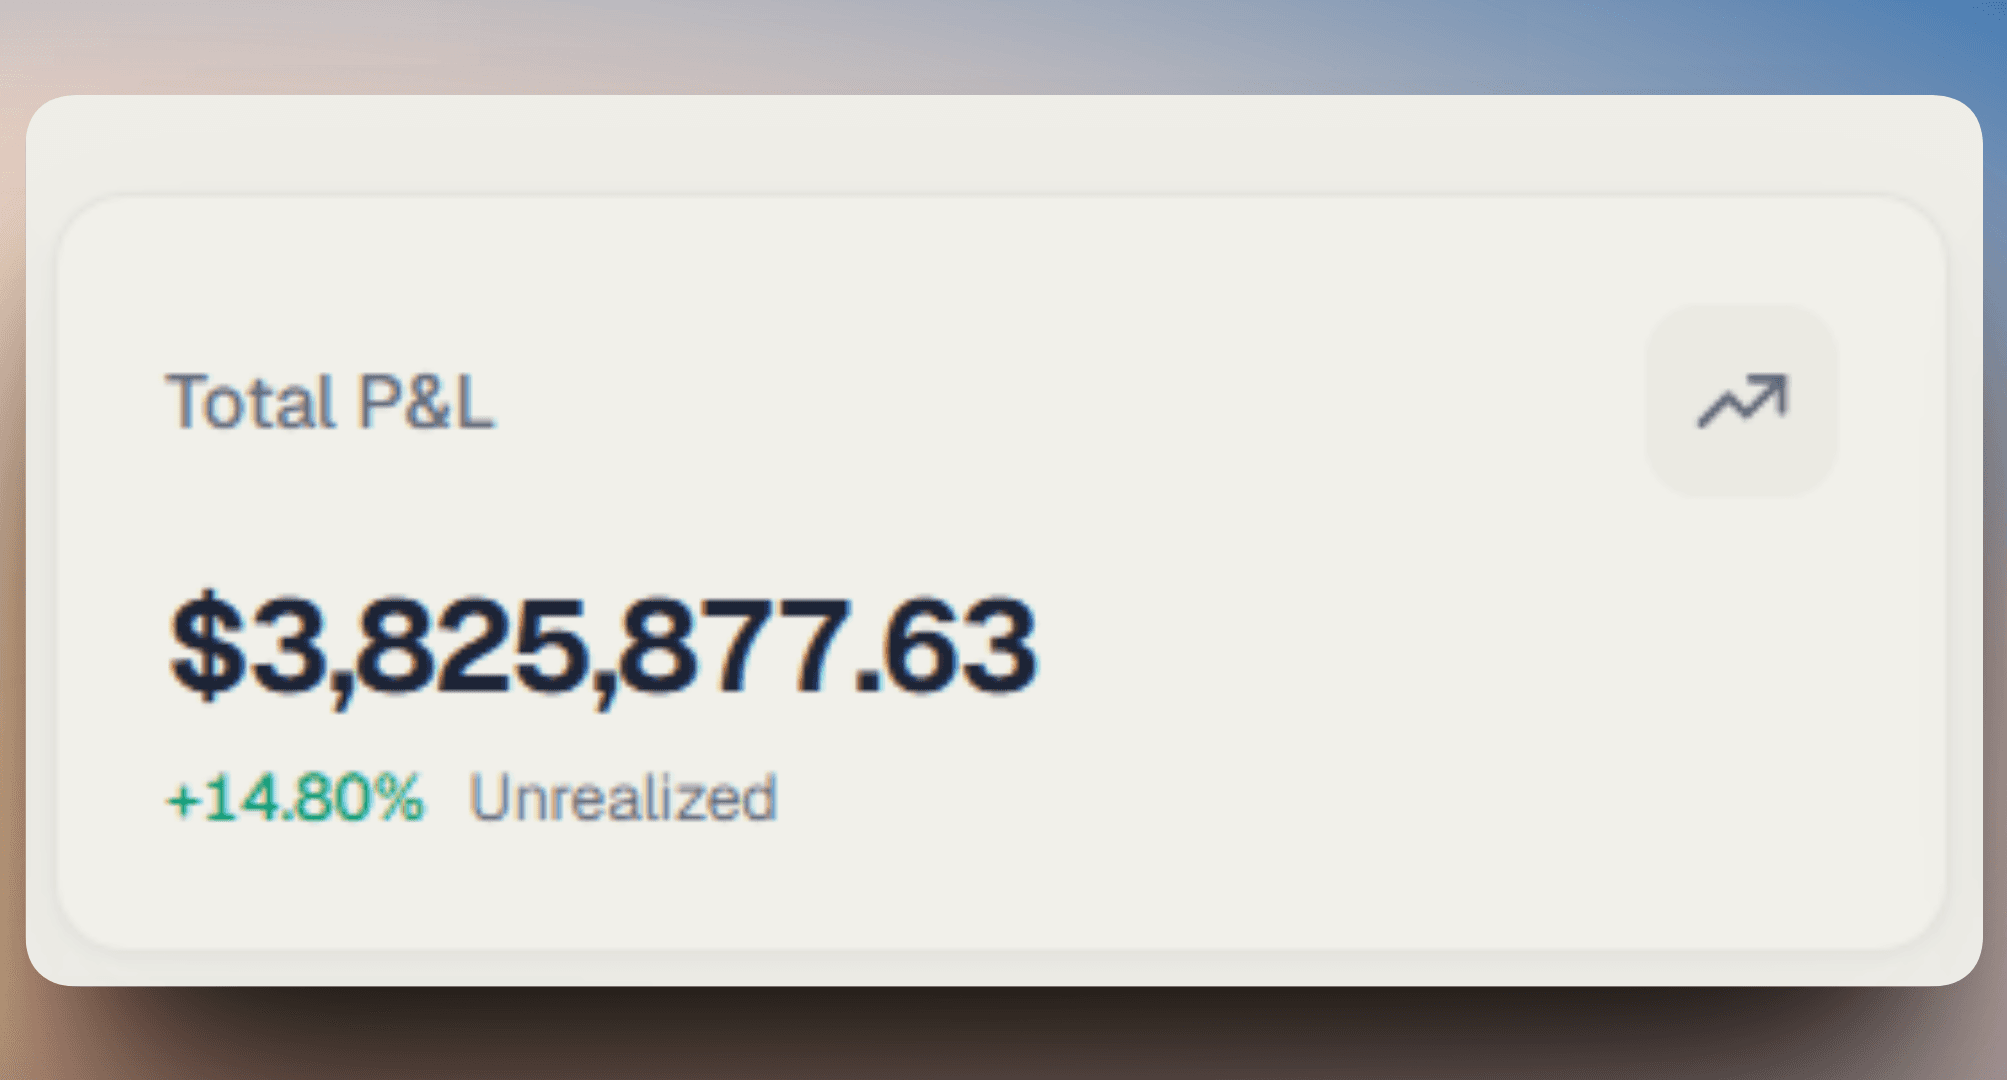
Total P&L - Your unrealized profit or loss - the total gain (or loss) on positions you still hold. The percentage shows the change over the time window selected in the chart below.
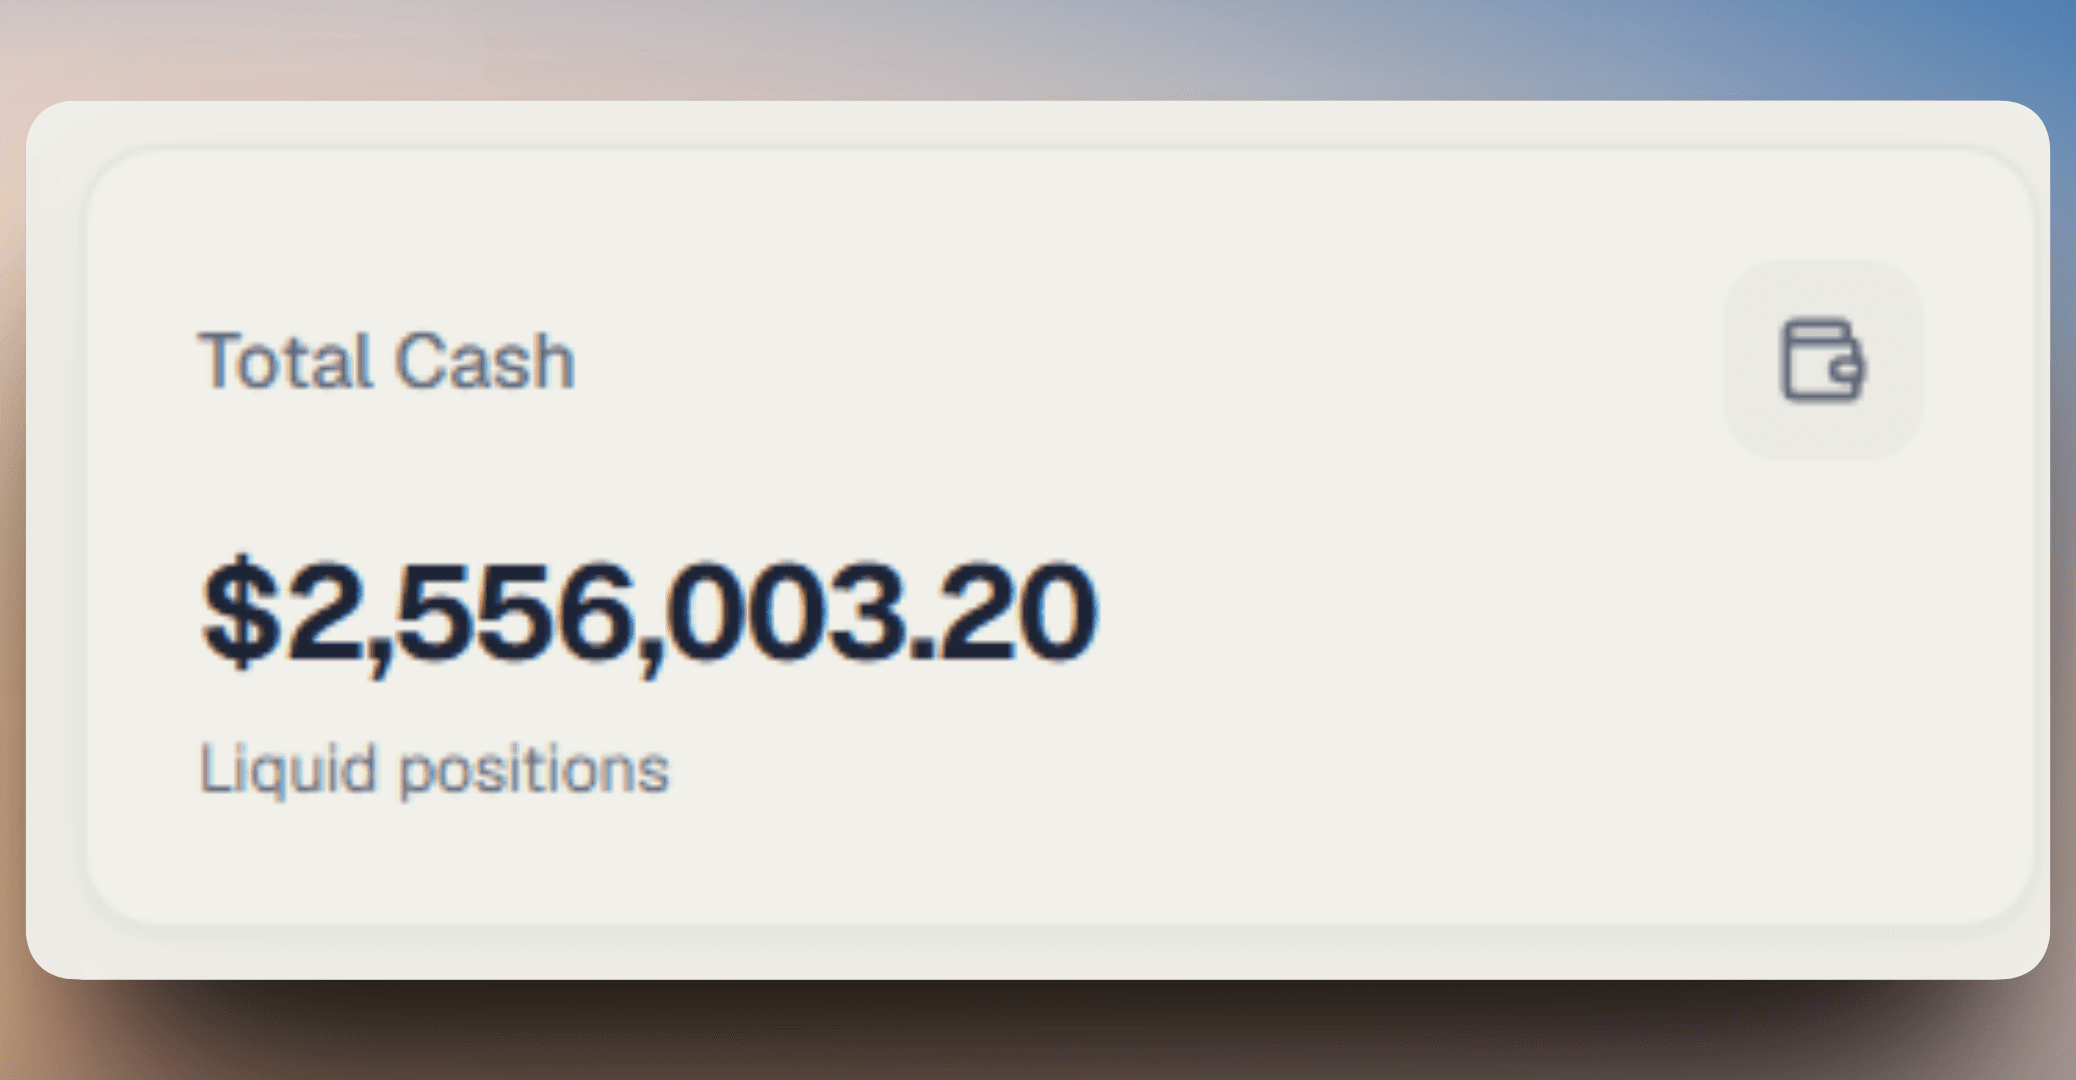
Total Cash - The sum of all liquid cash positions across your bank and brokerage accounts. This is money available to deploy immediately.
Net Worth = Total AUM − Total Liabilities. You'll see Net Worth plotted alongside AUM in the Financial Overview chart just below.
Financial Overview chart
The large chart on the left tracks two lines over time:
- AUM (solid green line) - your total assets over the selected period.
- Net Worth (dashed orange line) - your assets minus your liabilities.
Use the buttons at the top right of the chart - 1W, 1M, 3M, 6M, 1Y, ALL - to change the time window. The percentage shown next to the dollar figure (e.g. +5.33%) is the change over that window.
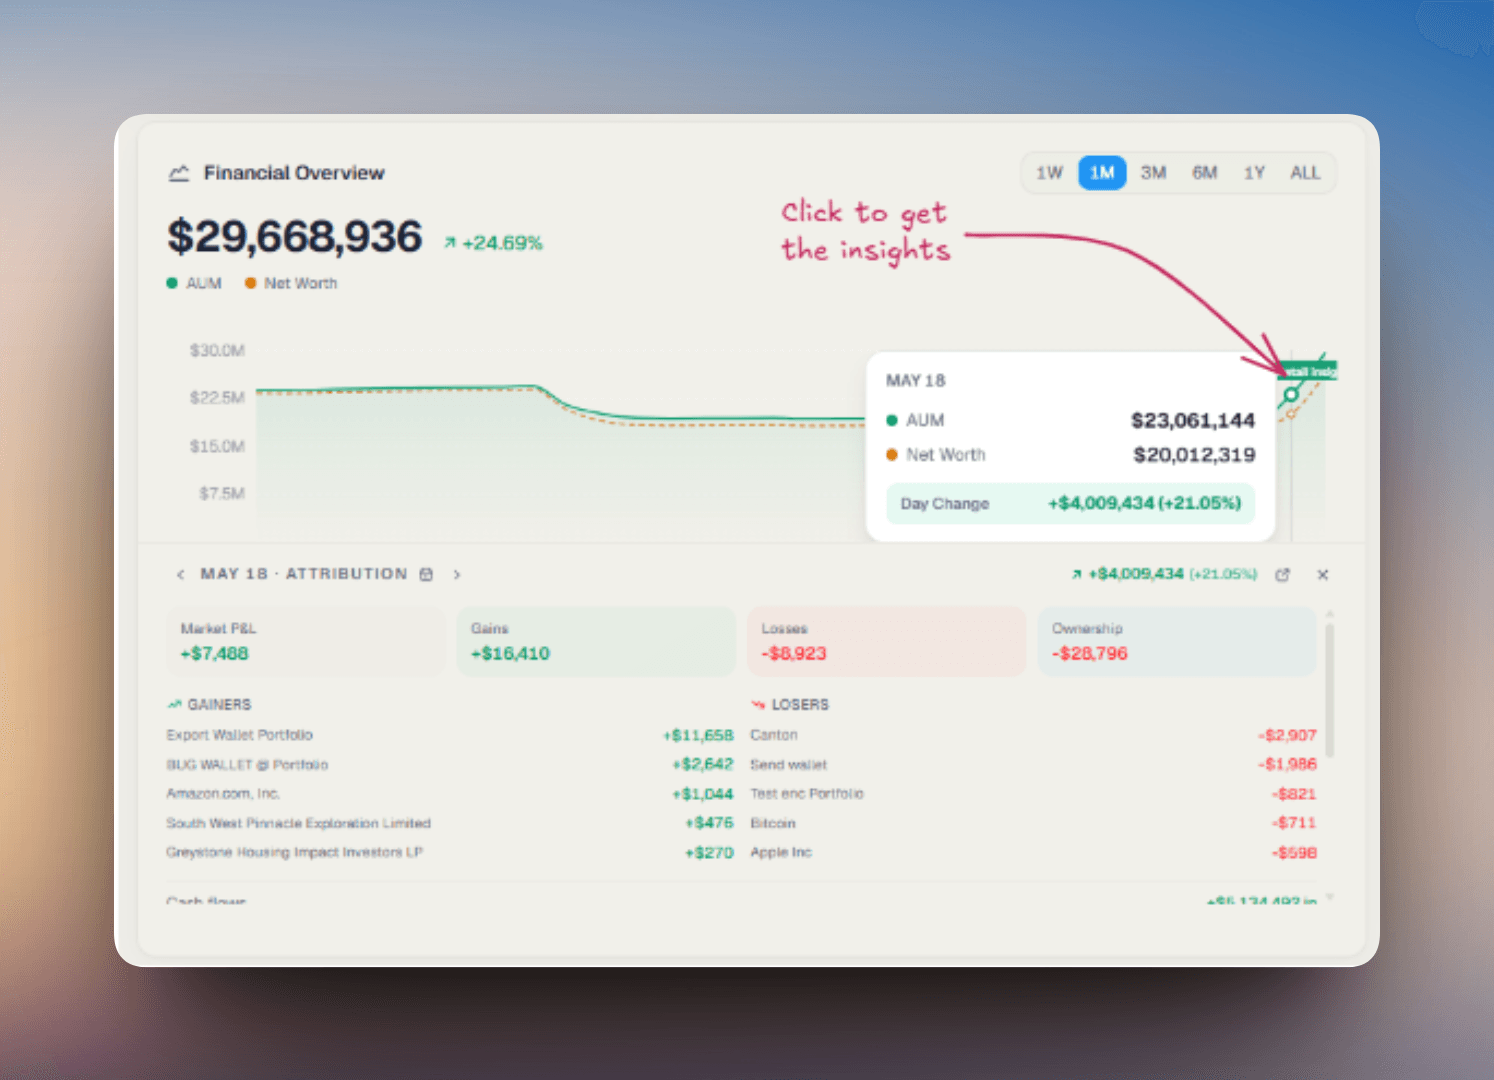
Click the Insights button on the chart to open a detailed attribution panel for the selected day. It breaks down your portfolio's movement into three components:
- Market P&L - the net change driven purely by market price movements across all your holdings.
- Gains - the total positive contribution from positions that moved up that day.
- Losses - the total negative drag from positions that moved down.
Below the summary, the panel lists individual Gainers and Losers - the specific holdings that drove the day's move, ranked by their dollar contribution. This is the fastest way to answer "why did my portfolio move today?"
When the two lines move together, your debt level is steady. When the gap widens, you're either taking on more debt or paying it down - a quick way to spot leverage trends.
Top assets
On the right side of the screen, the Top Assets panel ranks your individual holdings by current value - largest first. For each asset you see:
- Name and category - for example, "Tesla Inc" tagged as Public Equity, or "2727 Smith Street" tagged as Real Estate.
- Value - the current market value of that single holding.
- Return - total return on that holding since acquisition, shown in green for gains and red for losses.
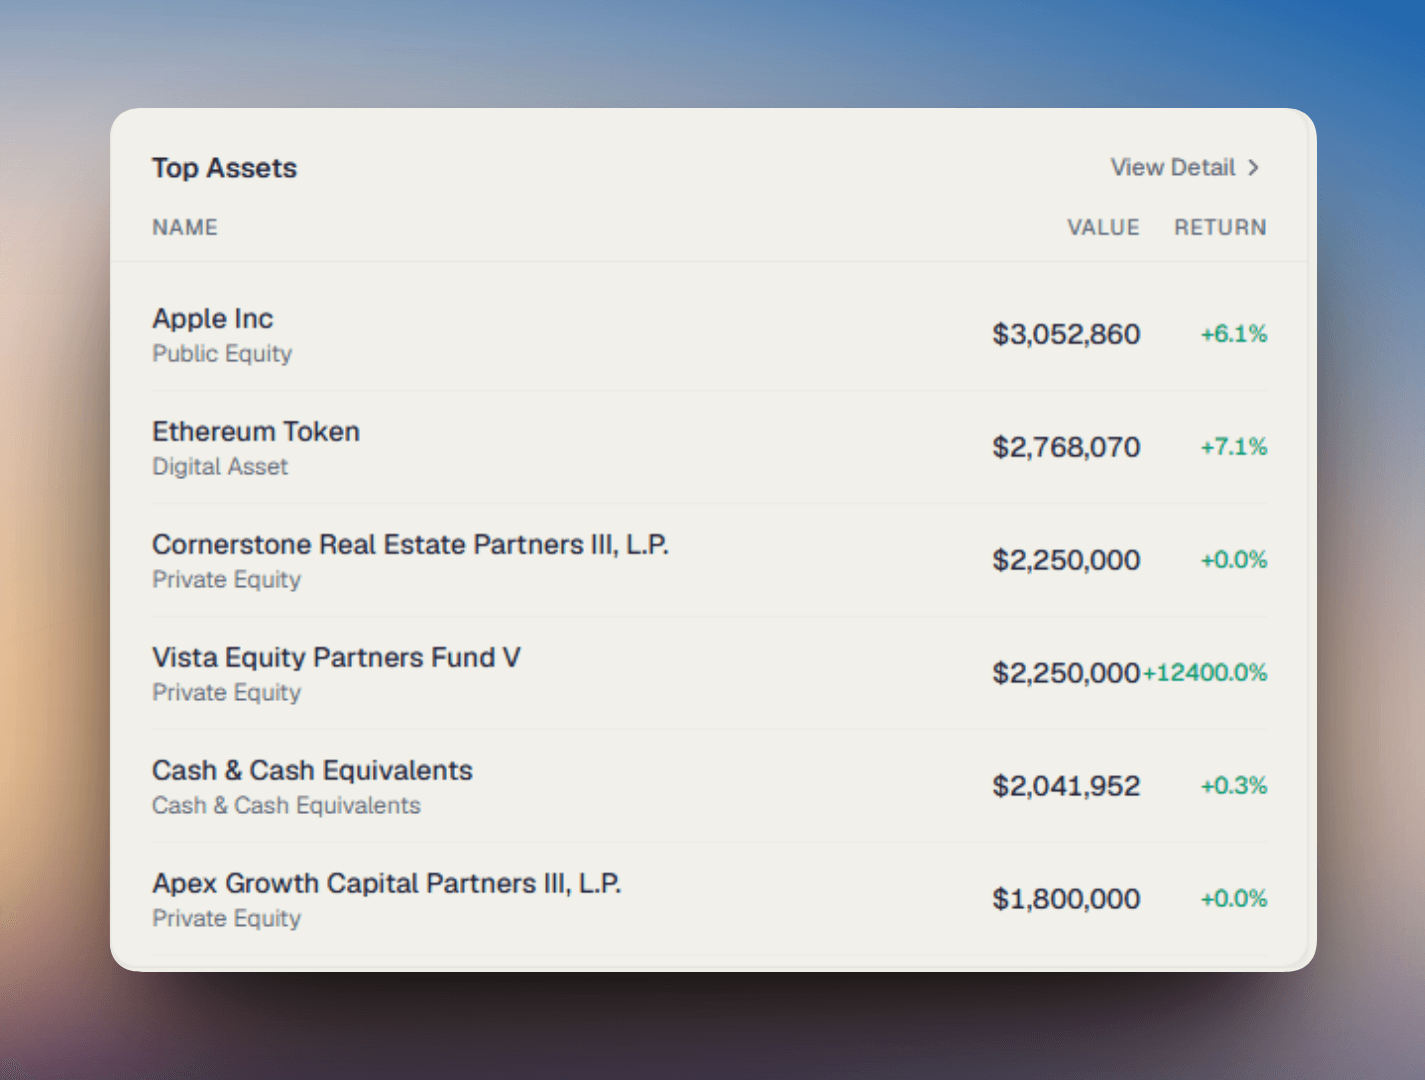
Click View Detail in the top right of the panel to see your complete asset list with filtering, sorting, and per-holding analytics.
Holdings by entity
Most high-net-worth households don't hold everything in one name - assets are typically spread across trusts, foundations, LLCs, and personal accounts. The Holdings by Entity panel shows you exactly how your wealth is distributed across those legal structures.
Each row shows:
- Entity name (e.g., "1K Growth") and its type tag (Trust, Foundation Co., etc.)
- Number of holdings inside that entity and what percentage of your total AUM it represents.
- Total value of all assets held inside that entity.
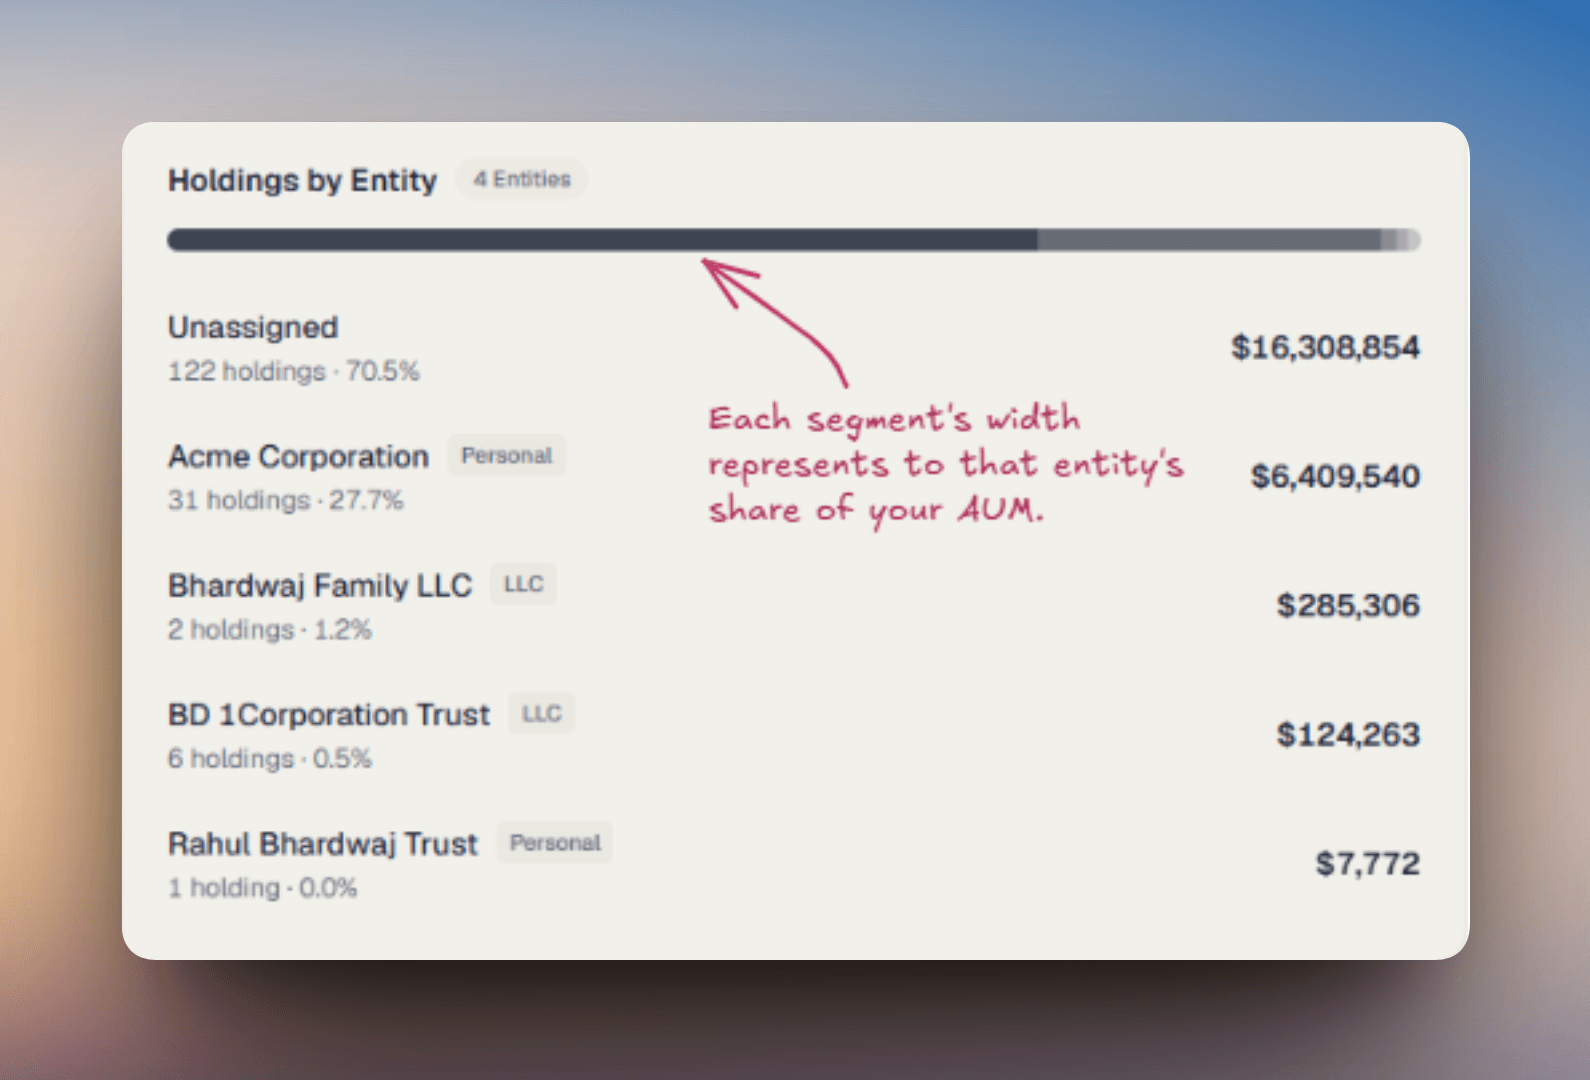
The colored bar at the top of the panel is a visual breakdown of your entity distribution.
If you see an Unassigned row, those are accounts that haven't been tagged to a specific entity yet. We recommend assigning every holding - it makes reporting, estate planning, and tax preparation cleaner.
Asset allocation
The donut chart shows how your AUM is split across asset classes. The center of the donut displays your total AUM as a quick reference.
The legend on the right lists each asset class and the percentage of your portfolio it represents - for example, Real Estate, Public Equity, Private Equity, Fixed Income, Digital Asset, and Uncategorized.
Some holdings - especially manually-added ones or unusual securities - may not be auto-tagged to an asset class. Open the holding and set its category to keep your allocation chart accurate.
Transactions & Capital Flow
The Transactions panel shows your most recent activity across all connected accounts - deposits, withdrawals, trades, dividends, and fees. Each row shows the provider, transaction type, date, and amount. Click See All to open the full transaction history with filters for date range, account, category, and amount.
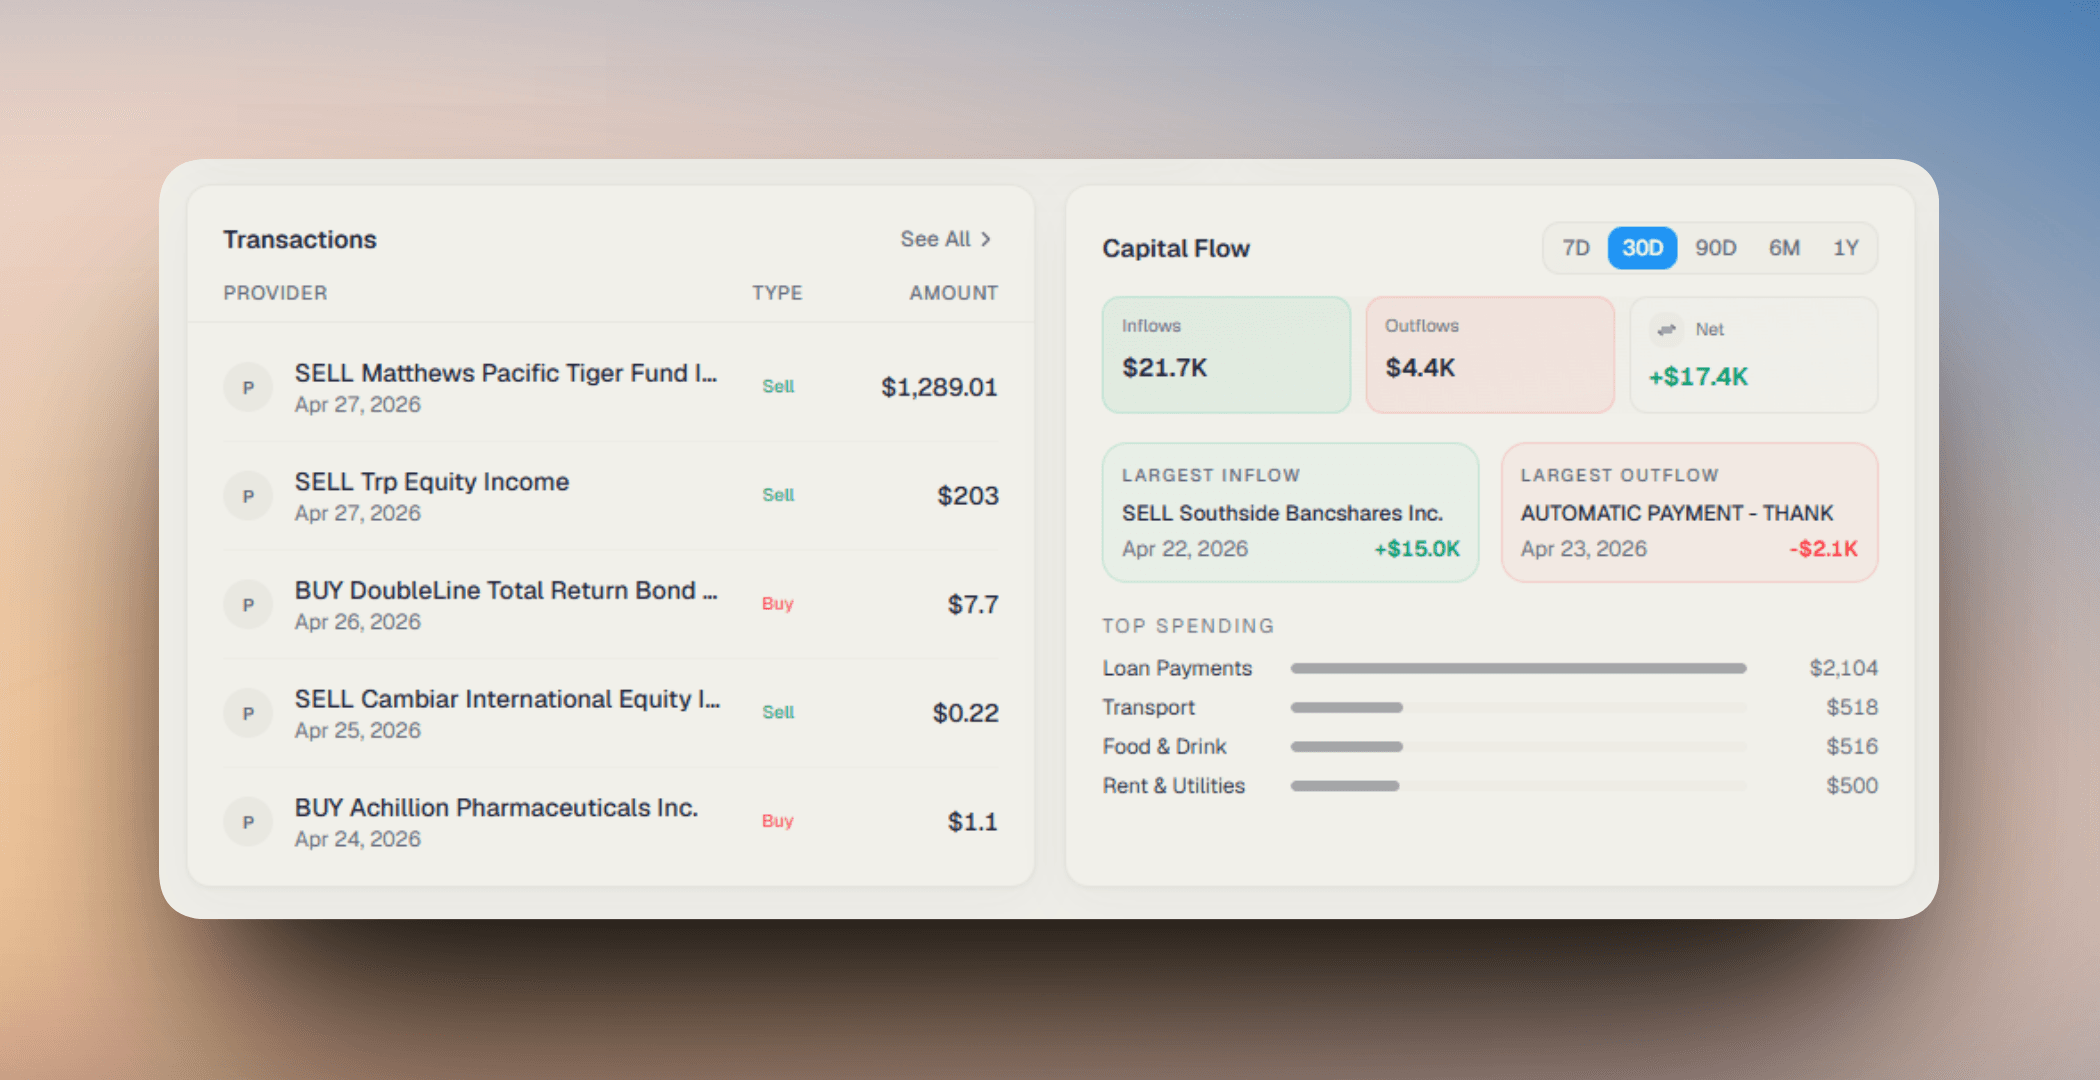
Capital Flow summarizes money in versus money out over the selected window (7D, 30D, 90D, 6M, or 1Y).
- Inflows - Total money coming into your accounts - deposits, sales, income, dividends, and capital distributions.
- Outflows - Total money leaving your accounts - withdrawals, purchases, fees, and expenses.
- Net - Inflows minus Outflows. A negative net (shown in red) means you spent more than came in over that window - not necessarily bad, but worth checking.
Latest news
The Latest News panel surfaces market and industry stories relevant to your portfolio - filtered by the asset classes and tickers you actually hold. Click View all to open the full news feed with category filters.
Where to go next
Here are the most common follow-on actions from the dashboard:
Add an account
Go to Plaid Sync and click + Add Account. You can add more accounts to an institution you've already connected, or click Connect New Institution to link a new bank or brokerage via Plaid.
Organize your holdings by entity
Go to Entity Portfolio to structure your wealth across trusts, LLCs, foundations, and holding companies - and assign every holding to the right legal entity.
Set up an entity
Entities → New Entity. Create a trust, LLC, or foundation, then assign holdings to it.
Add a manual asset
Holdings → Add Holdings. Use this for real estate, public equity, private equity, and digital assets.
Ask the AI assistant
Open the AI Assistant from the sidebar and ask natural-language questions about your portfolio - for example, "How did my real estate perform last quarter?"